Using Sage + graphviz + dot2tex + tikz + tikz2pdf to draw a graph
13 novembre 2012 | Mise à jour: 16 novembre 2012 | Catégories: latex, sage | View CommentsLet's first construct a graph that we will use in our examples below. We first construct a finite group generated by 2 by 2 matrices on the field \(GF(3)\). The group contains 24 elements. We then construct its Cayley graph:
sage: F = GF(3)
sage: gens = [matrix(F,2,[1,0, 1,1]), matrix(F,2, [1,1, 0,1])]
sage: group = MatrixGroup(gens); group
Matrix group over Finite Field of size 3 with 2 generators:
[[[1, 0], [1, 1]], [[1, 1], [0, 1]]]
sage: group.cardinality()
24
sage: G = group.cayley_graph()
Default graph plot
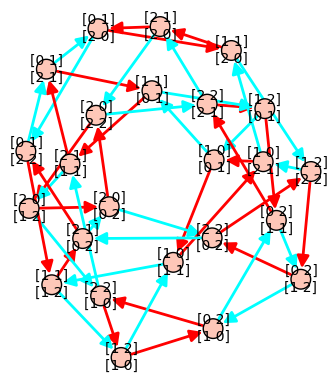
The default graph plot in Sage is:
sage: G.show(color_by_label=True)
Using view is actually broken when vertices are matrices because default format (format='tkz_graph') does not support it:
sage: view(G)
An error occurred.
...
LaTex error
Installing dot2tex + graphviz
One may get another kind of tikz output using the dot2tex.spkg together with graphviz. To know what is the latest available version of dot2tex use the command optional_packages():
sage: [x for x in flatten(optional_packages()) if 'dot2tex' in x]
['dot2tex-2.8.7-2']
The command to install the most recent version of dot2tex.spkg do from the command line (where you replace the version numbers by the above output):
sage -i dot2tex-2.8.7-2
As the documentation of G.layout_graphviz() says, install graphviz >= 2.14 so that the programs dot, neato, ... are in your path. The graphviz suite can be download from the graphviz website.
Basic Usage
This should allow the following to work:
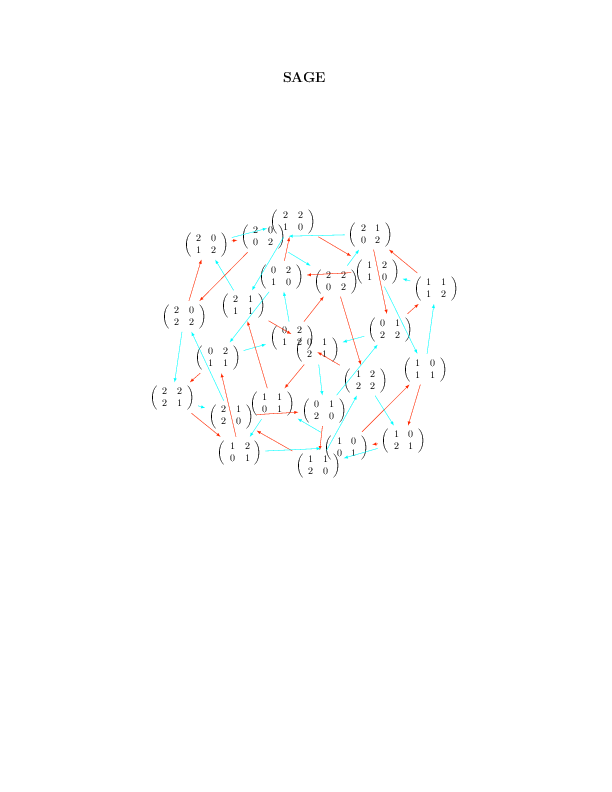
sage: G.set_latex_options(format='dot2tex', prog='neato')
sage: G.set_latex_options(color_by_label=True)
sage: view(G)
Limits of the basic usage
With the above usage, you will find that the command view(G) command is very slow and that sometimes it just doesn't work and gives a Latex error like this:
sage: G.set_latex_options(format='dot2tex', prog='dot')
sage: view(G)
An error occurred.
...
LaTex error
This is because the default compilation is just unappropriate for our usage (I still wonder for which usage it can be appropriate). In fact, the default compilation is first trying the conversion tex to dvi to png using latex and dvipng. If the dvipng part does not work for whatever reason (which is our case), it will then try the conversion dvi to ps to pdf using dvips and ps2pdf. This worked above for prog='neato' but not for prog='dot' because dvipng does not seem to like when latex produces Overfull \hbox and Overfull \vbox.
The Best Usage
The compilation strategy can be changed by using the engine option and by setting it to 'pdflatex'. Also the Overfull problem can be solved using the option tightpage=True:
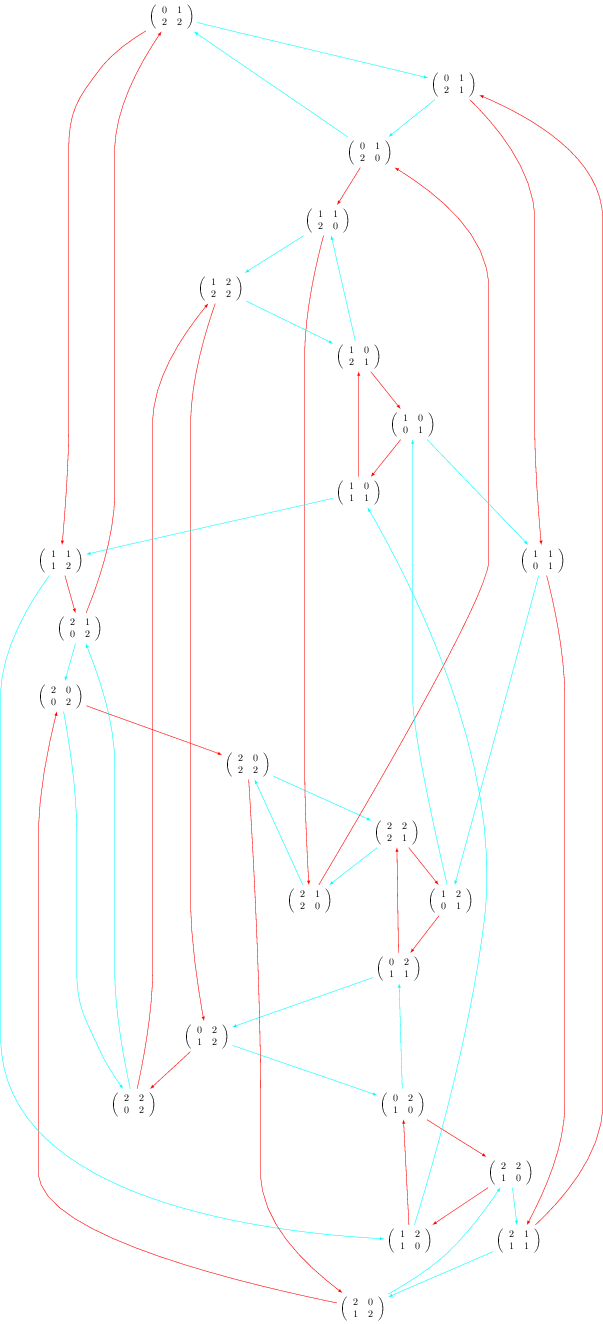
sage: G.set_latex_options(format='dot2tex', prog='dot')
sage: G.set_latex_options(color_by_label=True)
sage: view(G, engine='pdflatex', tightpage=True)
More options
The variable prog is for the program used for the layout. It must be a string corresponding to one of the software of the graphviz suite. Accepted values for prog are:
- 'dot' (the default)
- 'neato'
- 'twopi'
- 'circo'
- 'fdp'
When using format='dot2tex', other available options are:
sage: G.set_latex_options(color_by_label=True)
sage: G.set_latex_options(edge_labels=True)
sage: G.set_latex_options(edge_colors=I_dont_know_what)
Consult the help for more details:
sage: opts = G.latex_options()
sage: opts.set_option?
However, these other options do not seem to work perfectly. I don't know what format to give to edges_colors and edge_labels=True seems broken. I posted a workaround on the sagetrac to fix it.
Using the tikz2pdf script instead of the command view
Alternatively, when I get problems with the view command, I use my script tikz2pdf instead:
sage: G.set_latex_options(format='dot2tex', prog='dot')
sage: G.set_latex_options(color_by_label=True)
sage: G.latex_options()
LaTeX options for Digraph on 24 vertices: {'prog': 'dot', 'color_by_label': True, 'format': 'dot2tex'}
sage: s = G.latex_options().dot2tex_picture()
sage: f = open('graph_dot.tikz', 'w')
sage: f.write(s)
sage: f.close()
sage: !tikz2pdf graph_dot.tikz
Using template ...
tikz2pdf: calling pdflatex...
tikz2pdf: Output written to 'graph_dot.pdf'.
Draw a graph of matrices in LaTeX using Sage
18 octobre 2012 | Catégories: latex, sage | View CommentsIn version 5.3 of Sage, if the vertices of a graph are matrices, then the default latex output does not compile. The default format is a tikzpicture and uses the tkz-berge library. One solution is to change the format to dot2tex. See below.
The default tikz output is:
sage: m = matrix(3, range(9))
sage: m.set_immutable()
sage: G = Graph()
sage: G.add_vertex(m)
sage: latex(G)
\begin{tikzpicture}
%
\useasboundingbox (0,0) rectangle (5.0cm,5.0cm);
%
\definecolor{cv0}{rgb}{0.0,0.0,0.0}
\definecolor{cfv0}{rgb}{1.0,1.0,1.0}
\definecolor{clv0}{rgb}{0.0,0.0,0.0}
%
\Vertex[style={minimum size=1.0cm,draw=cv0,fill=cfv0,text=clv0,shape=circle},
LabelOut=false,L=\hbox{$\left(\begin{array}{rrr}
0 & 1 & 2 \\
3 & 4 & 5 \\
6 & 7 & 8
\end{array}\right)$},x=2.5cm,y=2.5cm]{v0}
%
%
\end{tikzpicture}
This output does not compile. Here is the error I get:
sage: view(G)
An error occurred.
This is pdfTeX, Version 3.1415926-1.40.10 (TeX Live 2009) (format=pdflatex 2011.4.19)  18 OCT
2012 21:34
entering extended mode

[...]

! Use of \tikz@@scope@env doesn't match its definition.
\pgfutil@ifnextchar #1#2#3->\let \pgfutil@reserved@d =#1\def \pgfutil@reserved@a {
                                                                                  #2}\def \pgf
util@reserved@b {#3}\futurelet \pgfutil@let@token \pgfutil@ifnch
l.54 \end{array}\right)$},x=2.5cm,y=2.5cm]{v0}

If you say, e.g., `\def\a1{...}', then you must always
put `1' after `\a', since control sequence names are
made up of letters only. The macro here has not been
followed by the required stuff, so I'm ignoring it.

! Use of \tikz@@scope@env doesn't match its definition.

[...]

!  ==> Fatal error occurred, no output PDF file produced!

Latex error
The command to install dot2tex:
sage -i dot2tex-2.8.7-2
As the documentation of G.layout_graphviz() says, install graphviz >= 2.14 so that the programs dot, neato, ... are in your path. This allows the following to work:
sage: m = matrix(3, range(9))
sage: m.set_immutable()
sage: G = Graph()
sage: G.add_vertex(m)
sage: G.set_latex_options(format='dot2tex')
sage: view(G)
To obtain the tikz code:
sage: tikz_string = G.latex_options().dot2tex_picture()
sage: print tikz_string
\begin{tikzpicture}[>=latex,line join=bevel,]
%%
\node (012345678) at (34bp,22bp) [draw,draw=none]
{$\left(\begin{array}{rrr}0 & 1 & 2 \\3 & 4 & 5 \\6 & 7 &
8\end{array}\right)$};
%
\end{tikzpicture}
Mon préambule latex
04 juillet 2012 | Catégories: latex | View CommentsVoici le préambule latex que j'utilise souvent:
\documentclass[12pt]{article}

\usepackage{amsmath}
\usepackage{amsfonts}
\usepackage{latexsym}
\usepackage{graphicx}
\usepackage{amssymb}
\usepackage{amsthm}
\usepackage[margin=2cm]{geometry}
\usepackage{url}
\usepackage{color}
\usepackage{enumerate}
\usepackage[shortlabels]{enumitem} %pour commencer les enumerations a des nombres differents
\usepackage[small]{caption}
\usepackage{cite}
Pour des fichiers en français, j'utilise les packages suivants:
\usepackage[T1]{fontenc}     % Hyphénation des mots accentués
\usepackage{lmodern}         % Polices vectorielles

\usepackage[french]{babel}   % Vocabulaire en francais
\usepackage[utf8]{inputenc}  % Codage UNICODE (UTF-8)
Modification du script tikz2pdf de Hans Meine
12 décembre 2011 | Catégories: latex | View CommentsIl y a deux raisons pour externaliser des images tikz d'un fichier .tex. La première est que les images tikz prennent parfois beaucoup de temps à compiler. La deuxième est que certains éditeurs n'acceptent pas les images tikz. Il faut donc trouver une manière de les transformer en format .pdf.
Ce processus d'externalisation est rendu possible grâce à la librairie external écrite par Christian Feuersänger, auteur de pgfplots. Cette librairie est pratique et atteint l'objectif, mais la création des images pdf dépend toujours du fichier principal.
En faisant une recherche du mot clé tikz2pdf dans Google, je suis tombé sur la page web de Hans Meine qui répond exactement à cette question.
Pour certaines raisons, le script de Hans Meine crée un fichier nommé tikz2pdf_temp.pdf. De plus, par défaut, le script cherche pour des modfications du fichier et exécute une recompilation automatiquement. Comme je n'aimais pas ces comportements, je les ai changés. La version modifiée du script tikz2pdf est disponible ici.
Propulsé par Blogofile
S'abonner au Flux RSS
et aux Commentaires.

This work by Sébastien Labbé is licensed under a Creative Commons Attribution-ShareAlike 4.0 International License.