Using Sage + graphviz + dot2tex + tikz + tikz2pdf to draw a graph
13 novembre 2012 | Mise à jour: 16 novembre 2012 | Catégories: latex, sage | View CommentsLet's first construct a graph that we will use in our examples below. We first construct a finite group generated by 2 by 2 matrices on the field \(GF(3)\). The group contains 24 elements. We then construct its Cayley graph:
sage: F = GF(3)
sage: gens = [matrix(F,2,[1,0, 1,1]), matrix(F,2, [1,1, 0,1])]
sage: group = MatrixGroup(gens); group
Matrix group over Finite Field of size 3 with 2 generators:
[[[1, 0], [1, 1]], [[1, 1], [0, 1]]]
sage: group.cardinality()
24
sage: G = group.cayley_graph()
Default graph plot
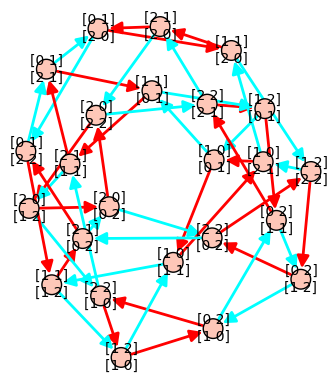
The default graph plot in Sage is:
sage: G.show(color_by_label=True)
Using view is actually broken when vertices are matrices because default format (format='tkz_graph') does not support it:
sage: view(G)
An error occurred.
...
LaTex error
Installing dot2tex + graphviz
One may get another kind of tikz output using the dot2tex.spkg together with graphviz. To know what is the latest available version of dot2tex use the command optional_packages():
sage: [x for x in flatten(optional_packages()) if 'dot2tex' in x]
['dot2tex-2.8.7-2']
The command to install the most recent version of dot2tex.spkg do from the command line (where you replace the version numbers by the above output):
sage -i dot2tex-2.8.7-2
As the documentation of G.layout_graphviz() says, install graphviz >= 2.14 so that the programs dot, neato, ... are in your path. The graphviz suite can be download from the graphviz website.
Basic Usage
This should allow the following to work:
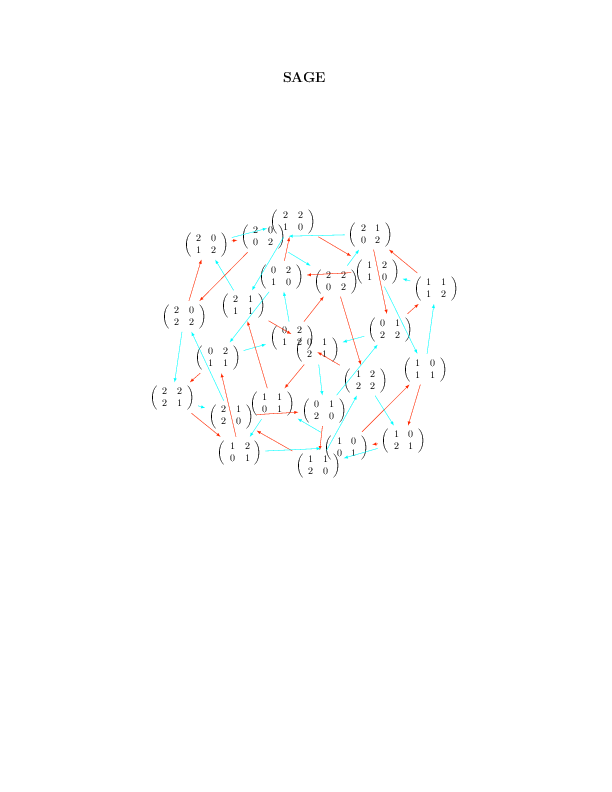
sage: G.set_latex_options(format='dot2tex', prog='neato')
sage: G.set_latex_options(color_by_label=True)
sage: view(G)
Limits of the basic usage
With the above usage, you will find that the command view(G) command is very slow and that sometimes it just doesn't work and gives a Latex error like this:
sage: G.set_latex_options(format='dot2tex', prog='dot')
sage: view(G)
An error occurred.
...
LaTex error
This is because the default compilation is just unappropriate for our usage (I still wonder for which usage it can be appropriate). In fact, the default compilation is first trying the conversion tex to dvi to png using latex and dvipng. If the dvipng part does not work for whatever reason (which is our case), it will then try the conversion dvi to ps to pdf using dvips and ps2pdf. This worked above for prog='neato' but not for prog='dot' because dvipng does not seem to like when latex produces Overfull \hbox and Overfull \vbox.
The Best Usage
The compilation strategy can be changed by using the engine option and by setting it to 'pdflatex'. Also the Overfull problem can be solved using the option tightpage=True:
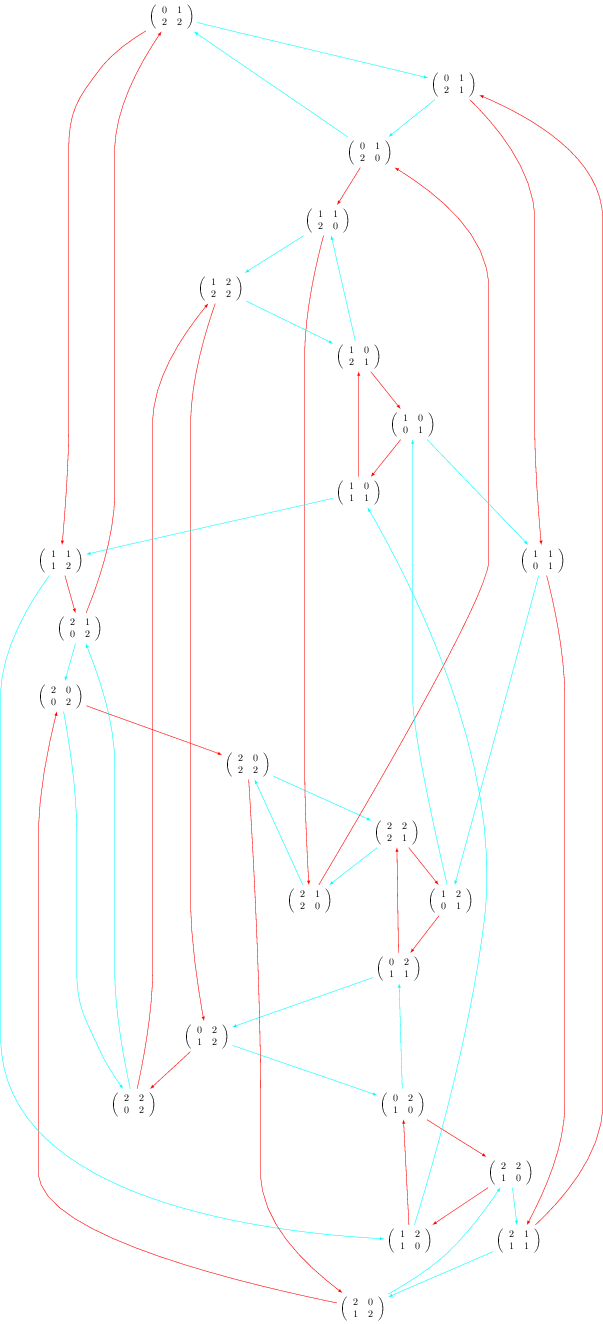
sage: G.set_latex_options(format='dot2tex', prog='dot')
sage: G.set_latex_options(color_by_label=True)
sage: view(G, engine='pdflatex', tightpage=True)
More options
The variable prog is for the program used for the layout. It must be a string corresponding to one of the software of the graphviz suite. Accepted values for prog are:
- 'dot' (the default)
- 'neato'
- 'twopi'
- 'circo'
- 'fdp'
When using format='dot2tex', other available options are:
sage: G.set_latex_options(color_by_label=True)
sage: G.set_latex_options(edge_labels=True)
sage: G.set_latex_options(edge_colors=I_dont_know_what)
Consult the help for more details:
sage: opts = G.latex_options()
sage: opts.set_option?
However, these other options do not seem to work perfectly. I don't know what format to give to edges_colors and edge_labels=True seems broken. I posted a workaround on the sagetrac to fix it.
Using the tikz2pdf script instead of the command view
Alternatively, when I get problems with the view command, I use my script tikz2pdf instead:
sage: G.set_latex_options(format='dot2tex', prog='dot')
sage: G.set_latex_options(color_by_label=True)
sage: G.latex_options()
LaTeX options for Digraph on 24 vertices: {'prog': 'dot', 'color_by_label': True, 'format': 'dot2tex'}
sage: s = G.latex_options().dot2tex_picture()
sage: f = open('graph_dot.tikz', 'w')
sage: f.write(s)
sage: f.close()
sage: !tikz2pdf graph_dot.tikz
Using template ...
tikz2pdf: calling pdflatex...
tikz2pdf: Output written to 'graph_dot.pdf'.
Propulsé par Blogofile
S'abonner au Flux RSS
et aux Commentaires.

This work by Sébastien Labbé is licensed under a Creative Commons Attribution-ShareAlike 4.0 International License.