Some small Sage tricks
14 décembre 2012 | Catégories: sage | View CommentsBelow are some Sage tricks that I gathered from other users of Sage, from sage-devel and other places since one year.
Stop the focus in the Notebook
This Notebook hack of the day was published on sage-devel by William Stein during May 2012 to fix that focus movement in the Notebook:
html('<script>cell_focus=function(x,y){} </script>')
Consult the documentation of a function in the browser
Open the documentation of a particular function in a web browser, from either the command-line or the notebook:
sage: browse_sage_doc(factor)
It works also for methods of an object:
sage: m = matrix(2, range(4))
sage: browse_sage_doc(m.inverse)
I found this command when I consulted the help():
sage: help()
Implicit multiplication
Some behavior in Sage can be made implicit like multiplication and variable definition. This might be good for new users coming from Maple for instance.
Normally, this syntax raises an error:
sage: 34x
------------------------------------------------------------
   File "<ipython console>", line 1
     34x
       ^
SyntaxError: invalid syntax
It is possible to make it work:
sage: implicit_multiplication(True)
sage: 34x
34*x
Implicit variable definition
The following works only in the Sage Notebook. It allows to turn on automatic definition of variables:
sage: automatic_names(True)
sage: x + y + z
x + y + z
Turn out automatic show when using plot
Set the default to False for showing plots using any plot commands:
sage: show_default(False)
I prefer False but you may not.
Rerun the patchbot
One can re-run the tests of a particular ticket by adding ?kick to the url of the ticket on the patchbot Sage server. For example, to rerun the tests on the ticket #13461, one can load the following page:
http://patchbot.sagemath.org/ticket/13461/?kick
This trick was shared on sage-devel during August 2012.
Python debugger
The majority of the Best Practices for Scientific Computing are followed by the Sage Development model. But, there is one principle that at least I do not use enough : a debugger. However, a Python debugger exists and a tutorial for using the Python debugger is available on onlamp.com.
I remember that discussion on sage-devel Poll: which debugger do you use? where developers were sharing their debugger tricks. It seems that using print statements is unavoidable.
Computing basic statistics with R
I always knew R is in Sage but never used it even if sometimes I need to compute some statistics of list of numbers. In Sage, one can print statistics of a list of numbers using R:
sage: L = [randint(0,100) for _ in range(20)]
sage: r.summary(L)
   Min. 1st Qu.  Median    Mean 3rd Qu.    Max.
  14.00   27.75   57.50   53.45   69.00   98.00
Creation of the number field in \(\sqrt{5}\)
Before learning it from this video of William Stein, I did not know that the square brackets could be used to create such number field:
sage: A = ZZ[sqrt(5)]
sage: a,sqrt5 = A.gens()
sage: A
Order in Number Field in sqrt5 with defining polynomial x^2 - 5
sage: sqrt5
sqrt5
Using Sage locally in the notebook from a server
First, log into the server using the following port setup:
ssh -L 8389:localhoat:8389 [SERVER]
Start the notebook with the given port:
sage -notebook port=8389
This ask for a password, if you forget it, you may reset it by first opening Sage, and by starting the notebook with the option reset=True:
sage: notebook(port=8389, reset=True)
Then, by opening the browser at the following adress, I can log in to the notebook from the server:
http://localhost:8389/home/admin/
Going from Mercurial to Git
Sage will soon move from Mercurial to Git. In the past, I tried to understand the difference between Mercurial and Git. I was never able to find a simple text or blog post on the web explaining in a simple way the differences. One diffence would be about branching. But I was not using branches with Mercurial... As I see it, differences between Mercurial and Git are hard to explain or at least hard to understand.
Anyway, I once found this tutorial on the Git version control system: Understanding Git Conceptually where the approach is "conceptual" and maybe easier for the mathematician. For instance, in Section 1 it is written that repositories can be "visualized as a directed acyclic graph of commit objects". I still haven't go through this tutorial but I consider to start with this one.
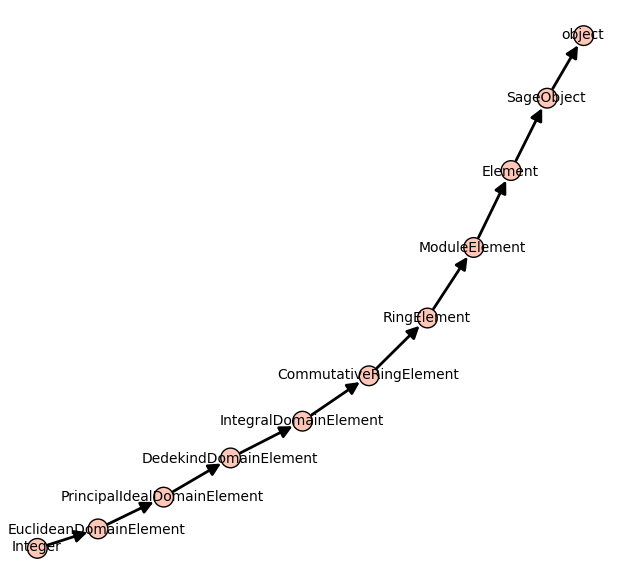
Inheritance tree
One may draw the inheritance tree of a class with the following command:
sage: class_graph(Integer).plot()
Propulsé par Blogofile
S'abonner au Flux RSS
et aux Commentaires.

This work by Sébastien Labbé is licensed under a Creative Commons Attribution-ShareAlike 4.0 International License.